


How to automate monthly spreadsheet reports with Python and pandas
Turn a monthly spreadsheet chore into a script: read the files with pandas, clean them, build a formatted workbook and email it on a schedule.
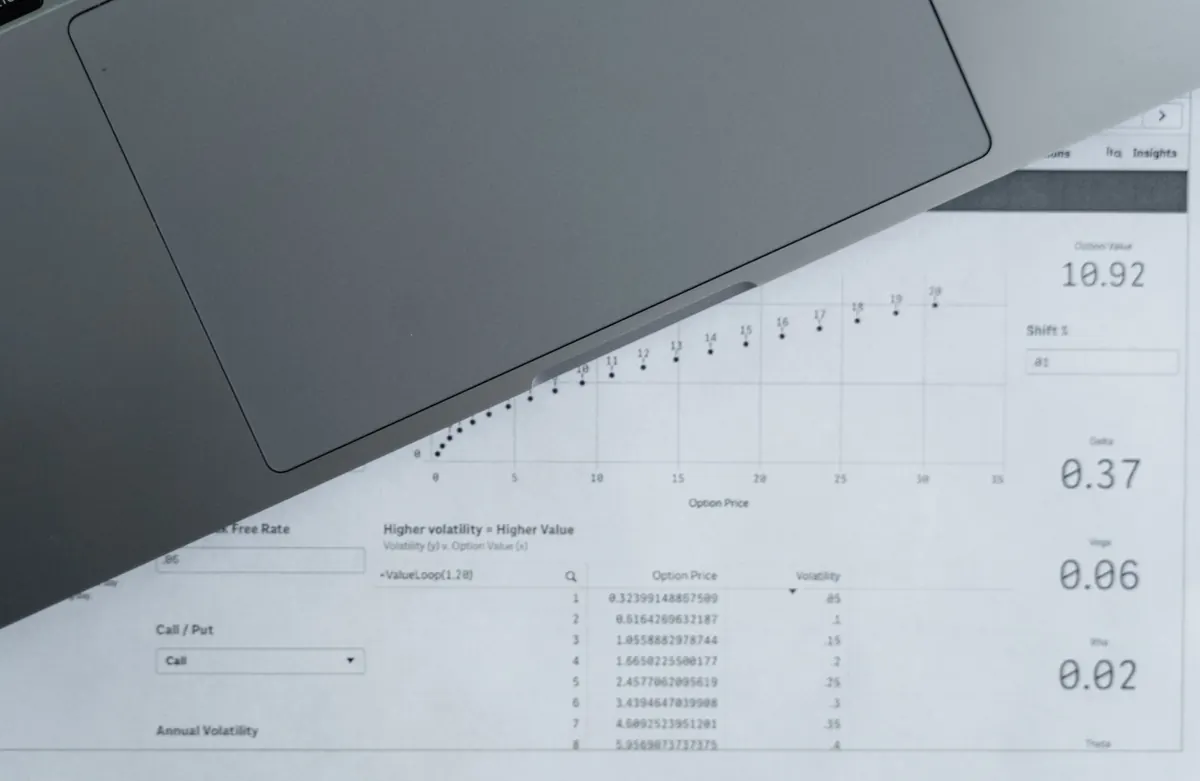
Every month, the same ritual: export three spreadsheets, fix a column of dates by hand, paste the totals into a template, and email it round before lunch. It works. It is also a poor use of a morning that could go on something a computer cannot do. Reading files, tidying columns, building a summary and sending it out on the third working day of the month are exactly the tasks Python handles well, and pandas — the standard library for tabular data — does most of the heavy lifting.
The pipeline is short: read, clean, summarise, format, email, schedule. You can build it in an afternoon and adjust it later. Here is how each stage works in practice.
Read the files without opening Excel
Start where the data already lives. pandas reads .xlsx files with read_excel and .csv files with read_csv, and for a monthly job you rarely need to open a spreadsheet application at all. The arguments worth knowing are sheet_name, usecols and dtype. That last one matters more than people expect: account codes and invoice numbers should be read as text, otherwise leading zeros disappear and 0012345 becomes 12345.
If the same report arrives as a folder of files, loop over them rather than listing filenames by hand. Using pathlib, something like Path("exports").glob("*.xlsx") gives you every file, and pandas.concat stacks them into one table. Add a column with the source filename so you can trace a strange figure back later.
Before writing any more code, open one file and look at it properly. Print df.head() and df.shape. Merged cells, two header rows and totals sitting in the middle of the data all break the tidy grid pandas expects. Fixing the structure once, in one place, saves hours of confusing errors later.
Clean the data with rules you can test
Real exports are messy in predictable ways. The usual suspects:
- Dates arriving as text in dd/mm/yyyy, which is fine for you and useless for sorting.
- Amounts stored with currency symbols, spaces or thousands separators.
- The same category spelled three ways: Marketing, marketing, Mktg.
- Blank rows, repeated rows, and subtotal rows mixed into the detail.
- Columns that shift position when someone adds a field upstream.
pandas deals with each of these in a line or two. to_datetime with dayfirst=True converts UK-style dates; to_numeric with errors="coerce" turns unparseable amounts into blanks you can count; str.strip removes stray whitespace; a small mapping dictionary plus replace consolidates category names; drop_duplicates handles repeats.
The trick with errors="coerce" is that it hides problems rather than fixing them. Coerce, then count. If 200 of 5,000 dates fail to convert, you have found a real issue in the source data, and that is information worth having before the report goes out.
Add a few assertions before you write anything to disk:
- Row count is within a sensible range of last month's.
- The total of the amount column matches the source subtotal.
- No duplicate invoice numbers remain.
- Every category value sits on your known list.
Each check is three or four lines. Together they turn a silent wrong number into a clear failure message.
Build a report worth reading
Once the data is clean, the numbers are the easy part. groupby and pivot_table will produce monthly totals by category, by region or by cost centre in a couple of lines. What separates a useful report from a dump of figures is the formatting.
Write to Excel with pandas.ExcelWriter, using the xlsxwriter or openpyxl engine, and keep to two or three sheets: a summary, the detail behind it, and a short notes tab. Set column widths, apply a number format such as #,##0.00, bold the header row and freeze the top pane. Conditional formatting on a variance column does more for a reader's comprehension than another fifty rows of data.
Stamp the workbook with the generation date and the source filenames. When someone questions a figure six weeks later, that line answers the first two questions they will ask.
Email the finished report
Python can send email with smtplib and the email.message module: build an EmailMessage, set the subject and recipients, add a short body with two or three headline figures, and attach the workbook with add_attachment. Put month and year in the subject line so the thread stays searchable.
Credentials deserve care. Do not paste a password into the script. Store it in an environment variable or a configuration file kept outside version control, and use an app password where your provider supports one. If your organisation runs its own mail server, ask IT whether outbound SMTP is allowed from your machine, because on many corporate networks it is not. An internal relay or a transactional email service solves that.
Schedule it and drop the calendar reminder
On Windows, Task Scheduler runs the script on whatever day you choose. On macOS and Linux, it is a cron entry. Either way, run exactly the command you tested by hand, with the full path to the Python interpreter and the script, and set the working directory so relative paths behave.
Send the output and errors to a log file, appended with a date stamp. When a report fails in March, that log tells you whether the export was late or the code broke.
Build in a buffer. Running at 00:01 on the first of the month is asking for trouble, since month-end adjustments often land a day or two later. The third working day at 07:30 is a more realistic target. If your laptop is usually closed at that hour, a small cloud instance or a scheduled job on a build runner will do the same work reliably.
Guardrails for unattended runs
Automation earns trust slowly and loses it quickly. A report that arrives a day late is an irritation; a report with a wrong total that nobody notices is much worse. So make the script fail loudly. If a source file is missing, or one of your assertions trips, stop and send yourself an alert rather than emailing a broken attachment.
Never overwrite the raw exports. Write the finished workbook to a new dated filename, and keep the inputs in a folder nothing else touches. Keep the code in version control with a short README covering where the files come from, who to contact when a column moves, and how to run the thing manually.
For the first couple of cycles, send the automated report to yourself and compare it against the manual version line by line. If the figures feed statutory accounts, tax returns or regulatory filings, keep a human review step in the process and confirm the requirements with your accountant or compliance team. The script handles the arithmetic; accountability still belongs to a person.
Start with one month, then let it run
Build the first version for a single month's data, run it alongside your existing process, and compare. Once the two agree twice in a row, switch over. Keep the code plain enough that you can read it next February when a column has moved, and resist adding features you have not needed yet.
An afternoon of work, roughly twenty minutes of checking each month, and one recurring chore gone for good. That is a fair trade.
Photo: Tima Miroshnichenko / Pexels